Potential, Challenges and Opportunities

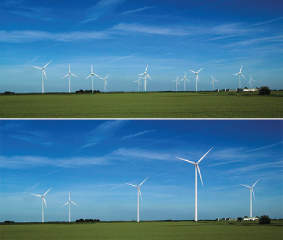
By Alicia Abrams, Consultant, DNV KEMA, USA
Wind turbines across the USA, primarily in California, are reaching the end of their useful lives. Repowering this older capacity with modern turbines has the potential to significantly increase power output from sites with good wind resources, while reducing negative environmental impacts. However, the planning can be complex and the costs sometimes hard to predict.
Beginnings of the Wind Industry in the USA
The US wind energy market took off in response to federal and state policy and tax incentives introduced in the 1970s and 1980s. California soon emerged as a global leader in new wind installations and by 1986 had approximately 1,000MW of wind power installed. The following decades saw growth in boom-and-bust cycles tied to the introduction and expiration of tax credits. While little new capacity was installed in the mid-1990s, by 2002 more than 3,000MW of new wind power generation had been added in the USA. Early wind installations across the USA are shown in Figure 1.
Improvements in Wind Turbine Technology
Wind turbine technology has improved significantly over the past 20 years, making turbines more powerful but also able to capture lower wind speeds, increasing the yearly energy output. Primarily, turbines have got taller (increased hub height) and larger (increased rotor diameter) in order to capture higher, steadier wind. Average turbine capacity today is approximately 2MW compared to the 100 to 750kW turbine sizes in the 1980s and 1990s. In addition, modern turbines have lower operation and maintenance (O&M) costs due to improved materials and technology (direct drive-train replacing the gearbox, advanced blade control) and availability of spare parts. New installations also have better monitoring systems and improved grid support features.
Environmental Impact
The reduced rotational speed of the larger rotors reduces noise emissions as well as bird and bat mortality, which in some areas is a growing concern. Many argue also that fewer but larger turbines reduce the visual impact, compared with the more cluttered layout of older wind farms. More importantly, the higher capacity and energy yield per area improves land use and, in many cases, a repowered wind farm will use less land to produce more energy. However, taller turbines are sometimes seen as more intrusive in the landscape and public concern around noise, shadow flicker or turbines being visible from afar can be a barrier to repowering efforts.
Repowering in Europe versus the USA
Wind repowering in the USA is a fairly young industry, despite its aging fleet. In Europe, on the other hand, several countries, including Germany, Denmark and Spain, have implemented repowering incentives to encourage the replacement of older capacity, leading to a stronger repowering development (Figure 2). Many of these incentives, often formulated as targeted feed-in tariffs, require capacity additions of more than double or triple the original capacity. A primary driver for repowering in Europe is the lack of onshore greenfield space with adequate wind resources on a densely populated continent, along with an ambition to expand renewable energy production. In the USA, on the other hand, greenfield space is typically abundant, except possibly in California, and no incentives exist for repowering per se, though repowered projects are typically eligible for the same incentives as greenfield projects.
Repowering Potential in the USA
Yet, as turbines are aging across the USA, repowering efforts are under way, with California leading the way. The US repowering potential in the near-term is focused in California due to its aging fleet and relatively limited greenfield space. In addition, California has ambitious goals for renewable energy production in the decades to come, including a 33% renewable portfolio standard (RPS) goal for 2020. States like Minnesota, Iowa and Texas have the next oldest fleets, with installations starting in the mid-1990s, but greenfield space is abundant and Texas and Iowa either lack, or have met, their current renewable energy goals. In the next 5–10 years, an additional 2,300MW of capacity is reaching the end of its life across the USA with 900MW in states with high RPS goals: California, Minnesota and Oregon.
Drivers and Barriers for Repowering
Other drivers for repowering exist, linked to economic potential from increased energy yield with modern technology or lower O&M costs, but are typically very site specific. Repowering can be economical for projects with higher capacity factors than available greenfield sites or where existing infrastructure and equipment, such as substations, roads or buildings, can be leveraged and lower the initial capital investment when compared with a greenfield development. On the other hand, site restrictions, such as limits on hub height or set-back rules, or transmission constraints limiting total capacity, can limit the profitability of the repowered project. In addition, uncertainty in the demolition and salvage costs and complexity in planning constitute barriers for owners or developers considering repowering. Typically, projects are repowered near the end of their economically productive life, as no drivers for accelerated repowering exist in the USA today.
Decommissioning Costs and Salvage Values Difficult to Predict
Estimates for demolition and salvage – in particular the net cost or value – vary widely. The site layout and terrain will affect the complexity of the demolition project and the cost of renting demolition equipment will vary depending on region, availability and accessibility to the site. Steel from the tower is the most valuable salvage asset, but scrap value varies based on regional supply and demand and the salvage estimate needs to include transportation and preparation costs. The re-sale market for older turbines is not well established and demand is higher for newer turbines; hence, the age of the turbines will affect both scrap value and potential re-sale value. In a recent survey of wind project demolition estimates conducted by DNV KEMA, the net cost varied significantly, depending on what costs were included and what assumptions were made for re-sale or scrap values, as shown in Figure 3.
Repowering Potential in California
At the end of 2011, California had approximately 4,000MW of wind turbine capacity installed. Of this capacity, 35% was installed prior to 1995 and only 13% has been repowered to date. The majority of the pre-1995 turbines have a capacity of 500kW or less. However, the three primary wind resource areas in California have experienced transmission constraints in recent years, sometimes limiting the capacity additions possible on already developed land. To date, repowering projects of 20–50% of original capacity are common, though sometimes the repowering effort does not result in a capacity increase, but rather in more effective land use or reduced environmental impact. Figure 4 identifies installed capacity in California, by age and turbine size.
Summary of Wind Repowering Outlook in the USA
Repowering activity in the USA has been limited to date and will be focused in California in the near-term, where approximately 1,200MW of capacity is over 20 years old. Compared with Europe, capacity increases at repowered sites have been modest, with capacity additions around 20–50%, or non-existing. In the next 5–10 years, an additional 2,300MW of capacity is reaching end of life across the USA, with 900MW in states with high RPS goals: California, Minnesota and Oregon. Turbines installed in the 1980s and 1990s range in capacity from 250kW to 1MW, compared with an average of 2MW today. Iowa and Texas have aging fleets, but plenty of greenfield space and no RPS drivers. While barriers to repowering exist, such as decommissioning costs and transmission constraints, repowering can be economical for projects with high capacity factors or where existing infrastructure can be leveraged, for a project reaching the end of its economically productive life.
Sponsor
This article is based on work sponsored by the Electric Power Research Institute. A full report is available at www.epri.com.
Biography of the Author
Alicia Abrams is a Consultant with DNV KEMA and since 2007 has provided technical expertise for utility and industry clients. Ms Abrams works primarily with integration of renewable resources into the electric grid, evaluating grid control, market operation and reliability issues along with conducting market research for energy storage products, wind power technology and future smart grid products.