Last year I wrote an article on the good, the bad and the ugly about wind turbines. The ugly was the lack of recycling for turbine blades that in many cases end up in landfills. To check out if anything has been improved since then and, on a larger scale to see how well the wind industry is doing in terms of the carbon footprint, this study follows. As a supporter and enthusiast about wind energy, it is quite important to know how wind turbines are playing their role toward sustainability and net zero emissions targets. In other words, how big is the footprint of a wind turbine?

By Ahmad Hemami, McGill University, Montreal, Canada
Digging into the matter, I came across figure 1. This figure is originally from the Intergovernmental Panel on Climate Change (IPCC), though I could not trace it back. This figure clearly shows the (great) difference between greenhouse gas pollution from fossil fuels and from renewable energy sources. For power generation carbon footprint is measured in units of CO2 equivalent (CO2e) mass per kWh of energy. This is for the total lifespan of a power-generating unit. For a product (any manufactured item) the carbon footprint is the amount of CO2e produced for manufacturing and usage of the product during its life cycle.
Finding (calculating) the footprint for either a product or power generation, is not a simple task, and in reality, in addition to the energy consumption for manufacturing/production it contains the upstream and downstream components. Upstream refers to all processes (and their cost and greenhouse gas emissions) for the raw material before reaching a production plant. Downstream refers to the processes involved in retiring an item from service, including recycling, if applicable. This is necessary for all major or minor components in a device or machine. In this respect, the more components are used in a product, the more complicated it is to determine the footprint. Finding out how many parts there are in a wind turbine is also a challenge. The only figure in a reliable source [1] shows 25,000 as the total number of pieces in a wind turbine.
Many factors exist that can be included in finding the footprint of a product, or they might be ignored if negligible. A complete sustainability study requires also the following:
- Information on the biodiversity protection.
- Information on land use and land cover classification (in Europe).
- Information on environmental risks.
- Information on electromagnetic field generation.
Moreover, in the case of wind turbines, the information about noise and visual impact of a wind farm could be added.
 Certainly, the process is extremely complicated and tedious to do, and it depends on various factors that may vary between regions and the way a product is used and might not even be known upfront. Indeed, the lifespan of no item is known before it is taken out of service, but it can only be guessed. In this respect, if down the road the expected 25 years of useful life for an item is cut short, its carbon footprint changes. This is especially true for many wind turbines that become obsolete or discontinued.
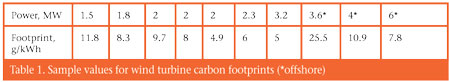
In figure 1, the CO2e per kWh for onshore and offshore wind farms are 11 and 12 g/kWh, respectively. On the other hand, a sample of carbon footprint calculations carried out between 2012 and 2019 (sources not given) for smaller wind turbines are shown in table 1 [2].
To find the carbon footprint of turbines of different sizes and manufacturers, I started with turbines around 6 MW, normally used onshore, and around 14 MW, normally used offshore. In doing that, one comes across Environmental Product Declaration (EPD), as managed by the International EPD system and according to ISO 14040 and 14044 Product Category Rules.
EPD reports can be found for many Siemens-Gamesa turbines in the EPD library [3]; one needs to select the appropriate categorisation. Each report, worth reading, gives plenty of detailed information about the sustainability and the factors that have been considered for the calculation of the carbon footprint. From these reports, one immediately realises how cumbersome it really is to allocate a number to the carbon footprint of a turbine because of so many components and so many factors. The same turbine could be installed on a 100- metres or a 165-metres tower, depending on the site. The energy production is, thus, variable.
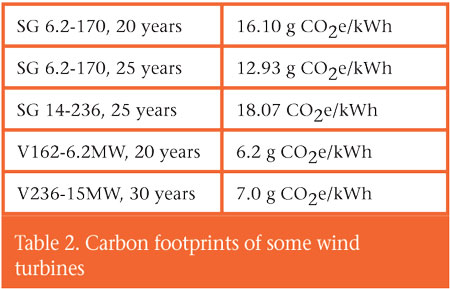 Also, the estimation of the service life has a significant effect on the amount of energy delivered by a wind turbine. For this reason, the calculations made in the Siemens Gamesa report have been carried out for 20 years and 25 years. The results for two models are summarised in table 2. In the values in Table 2 for two Siemens Gamesa turbines, only the most significant figures from the EPD reports are included.
Similar searches were carried out for Vestas, Enercon and GE Vernova turbines. The data for Vestas’s turbines can be accessed in reference [4], but unfortunately no data could be found for the other two manufacturers. Table 2 demonstrates that, since the reports are not identical and based on the same categories of data, a reasonable value for wind turbines carbon footprint can only be assigned if the parameters involved and the life cycle are normalised.
Further reading
[1] Vestas Annual Report 2024: https://mb.cision.com/Main/18886/4100723/3246654.pdf
[2] What’s the carbon footprint of a wind turbine? Yale Climate Connections: https://yaleclimateconnections.org/2021/06/whats-the-carbon-footprint-of-a-wind-turbine/
[3] www.environdec.com › library › epd9792
[4] Lifecycle assessment for various Vestas turbines: https://www.vestas.com/en/sustainability/environment/lifecycle-assessments


")